Key Points
- The trade deficit with China has cost the U.S. 3.82 million jobs since 2001.
- Three-quarters of the job loss is concentrated in manufacturing, a total of 2.89 million manufacturing jobs lost. Job loss has been most concentrated in tradeable sectors. This has led to a decline of high paying jobs.
- The state-by-state analysis below shows the number of jobs lost in each state and the percentage of those lost jobs which were in manufacturing.
- Repealing Most-Favored Nation (MFN) status for China would revoke preferential treatment for Chinese imports and give American producers the space needed to rebuild American manufacturing capacity.
Trade Deficit with China Has Cost the U.S. Millions of Jobs
In 2001, China was granted permanent normal trade relations (PNTR) by the U.S. which gave permanent preferential treatment to Chinese manufactured goods and encouraged the offshoring of manufacturing. Since 2001, the trade deficit with China has grown by about $300 billion. The trade deficit with China is by far the largest the U.S. runs with any country in the world. In 2022, the $382.9 billion trade deficit with China accounted for 32% of the $1.19 trillion total U.S. trade deficit.
Numerous studies have shown that the trade deficit with China costs the U.S. millions of jobs throughout the economy. This analysis updates a previous study by the Economic Policy Institute (EPI). We use EPI’s sectoral breakdown of U.S. employment with current state employment figures, as of February 2023, from the Bureau of Labor Statistics (BLS) to give an updated estimate of how many jobs the trade deficit with China costs the U.S. economy.
We find that the U.S. has lost 3.82 million total jobs due to the trade deficit with China. Manufacturing accounts for 2.89 million jobs lost, 75% of the total job loss due to China.
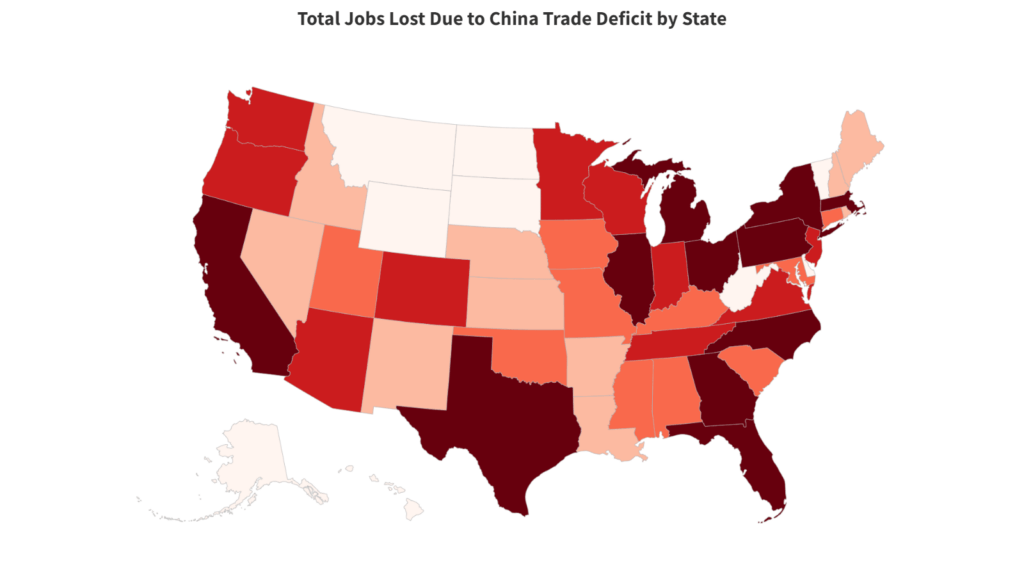
As shown in Figure 1, regions are not impacted uniformly throughout the country. Regions that were manufacturing hubs prior to 2001 have lost the most jobs relative to other regions where the manufacturing industry makes up a smaller share of the overall state economy. Yet, all 50 states have had some degree of job loss due to the trade deficit with China as shown in Table 1 in the appendix.
States that have a large concentration of technology firms, such as California and Texas, lost a significant number of manufacturing jobs. China’s strategic focus on the export of computers and consumer electronics severely impacted domestic manufacturers in these industries. California has one of the highest rates of job displacement at 3.6%, or about 654,000 jobs, mostly due to the massive volume of imports of electronics from China.
Figure 1: Total Job Displacement Due to Trade Deficit with China Since 2001:
More Action Needed to Decouple from China
Over the past several decades, China has engaged in a strategic export-led development strategy to fuel its economic growth. Their abundance of low-cost labor coupled with state-subsidized production enabled Chinese firms to undercut U.S. manufacturers’ goods in the domestic market which has led to a trade deficit across several key manufacturing industries.
As shown in CPA’s Domestic Market Share Index (DMSI), China held 28% of the share of manufactured goods in the U.S. market of the computer and electronic parts and 26% of electrical equipment, appliances, and components. China has the majority share of apparel and leather products with 61% of the U.S. market for such goods. It also has a sizeable share of the domestic market for textiles (23%) and furniture (18%). Taken as a whole, the trade deficit with China has led to an erosion of American manufacturing capacity.
Recent efforts to decouple from China have shown some success. After imposition of the Section 301 tariffs, the bilateral trade deficit with China has shrunk by $35.3 billion from its peak in 2018. Yet, in many cases as a result of the tariffs, Chinese manufacturing firms merely relocated to other countries to continue to export goods to the U.S. The total goods trade deficit reached a record $1.19 trillion last year as other countries, most prominently Mexico and Vietnam, have increased their contribution to the trade deficit.
To reverse an overreliance on China and rebuild manufacturing capacity, the U.S. should continue to pursue decoupling. Advocates of free trade often cite the gains from trade that consumers attain in the form of cheaper consumer goods. This view ignores how long-run trade deficits erode manufacturing capacity and cause the loss of high-paying jobs that are replaced with low-quality jobs.
A repeal of Most-Favored Nation (MFN) status for China would no longer provide preferential treatment to Chinese manufactured goods and instead apply tariffs in Column 2 of the Harmonized Tariff Schedule to all imports from China. Such action would continue our decoupling from the Chinese economy and provide the space needed to rebuild American manufacturing.
Table 1: Total Job Loss Due to Trade Deficit with China by State
| State | State Employment* | Jobs Lost Due to China | Manufacturing Jobs Lost | Manufacturing Job Loss as Percentage of Total |
| Alabama | 2,139,400 | 52,843 | 42,290 | 80% |
| Alaska | 326,500 | 2,775 | 1,961 | 71% |
| Arizona | 3,147,800 | 70,196 | 51,381 | 73% |
| Arkansas | 1,354,600 | 25,873 | 20,471 | 79% |
| California | 17,969,600 | 654,093 | 487,230 | 74% |
| Colorado | 2,887,700 | 70,749 | 51,182 | 72% |
| Connecticut | 1,687,500 | 35,606 | 27,200 | 76% |
| District of Columbia | 770,700 | 7,090 | 4,879 | 69% |
| Delaware | 479,900 | 6,719 | 4,759 | 71% |
| Florida | 9,681,900 | 161,688 | 115,319 | 71% |
| Georgia | 4,875,800 | 130,184 | 98,360 | 76% |
| Hawaii | 633,200 | 6,205 | 4,281 | 69% |
| Idaho | 845,100 | 23,832 | 18,004 | 76% |
| Illinois | 6,114,600 | 160,814 | 122,750 | 76% |
| Indiana | 3,236,900 | 94,517 | 79,099 | 84% |
| Iowa | 1,590,300 | 33,714 | 27,385 | 81% |
| Kansas | 1,448,000 | 24,616 | 19,435 | 79% |
| Kentucky | 1,991,900 | 48,204 | 38,474 | 80% |
| Louisiana | 1,946,000 | 23,936 | 17,717 | 74% |
| Maine | 646,800 | 11,966 | 9,034 | 75% |
| Maryland | 2,725,300 | 40,062 | 28,464 | 71% |
| Massachusetts | 3,735,800 | 115,810 | 84,965 | 73% |
| Michigan | 4,416,400 | 109,527 | 88,505 | 81% |
| Minnesota | 2,983,000 | 94,859 | 74,007 | 78% |
| Mississippi | 1,179,700 | 28,667 | 22,806 | 80% |
| Missouri | 2,962,000 | 58,055 | 44,594 | 77% |
| Montana | 518,100 | 5,699 | 4,071 | 71% |
| Nebraska | 1,043,300 | 17,110 | 13,191 | 77% |
| Nevada | 1,537,700 | 20,451 | 14,600 | 71% |
| New Hampshire | 699,500 | 25,602 | 19,772 | 77% |
| New Jersey | 4,321,400 | 93,342 | 68,027 | 73% |
| New Mexico | 862,800 | 11,303 | 7,960 | 70% |
| New York | 9,682,000 | 189,767 | 135,459 | 71% |
| North Carolina | 4,884,600 | 157,773 | 121,142 | 77% |
| North Dakota | 434,400 | 5,517 | 4,046 | 73% |
| Ohio | 5,575,500 | 138,830 | 110,062 | 79% |
| Oklahoma | 1,728,200 | 31,108 | 23,277 | 75% |
| Oregon | 1,989,600 | 72,421 | 55,636 | 77% |
| Pennsylvania | 6,094,400 | 137,124 | 104,609 | 76% |
| Rhode Island | 501,000 | 12,776 | 9,584 | 75% |
| South Carolina | 2,278,100 | 60,370 | 47,368 | 78% |
| South Dakota | 459,900 | 8,186 | 6,301 | 77% |
| Tennessee | 3,310,500 | 81,438 | 63,578 | 78% |
| Texas | 13,831,900 | 365,162 | 269,657 | 74% |
| Utah | 1,712,000 | 41,088 | 31,188 | 76% |
| Vermont | 307,500 | 9,010 | 6,892 | 76% |
| Virginia | 4,131,200 | 71,470 | 52,123 | 73% |
| Washington | 3,613,500 | 71,186 | 53,085 | 75% |
| West Virginia | 699,500 | 9,373 | 6,890 | 74% |
| Wisconsin | 2,997,400 | 90,521 | 75,301 | 83% |
| Wyoming | 288,700 | 2,454 | 1,736 | 71% |
| Total | 155,279,100 | 3,821,681 | 2,890,107 | 75% |
Note: State employment figures from BLS Establishment Survey, February 2023